チャートの生成と表示
このチュートリアルでは、SAPのデータからチャートを生成し、それをSAPのトランザクションにて表示する方法を示します。今回の例は以下のようになります。
トランザクションMM03(品目の表示)にて、”Sales chart”(販売チャート)ボタンを追加します。
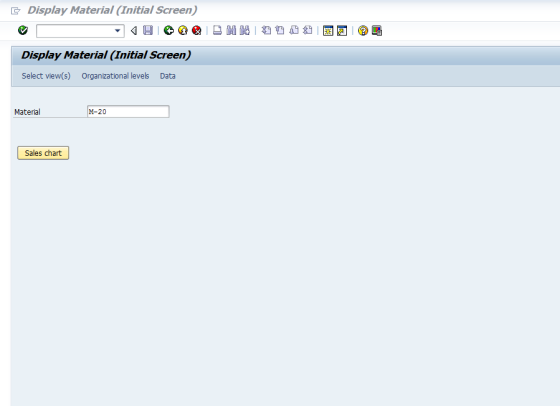
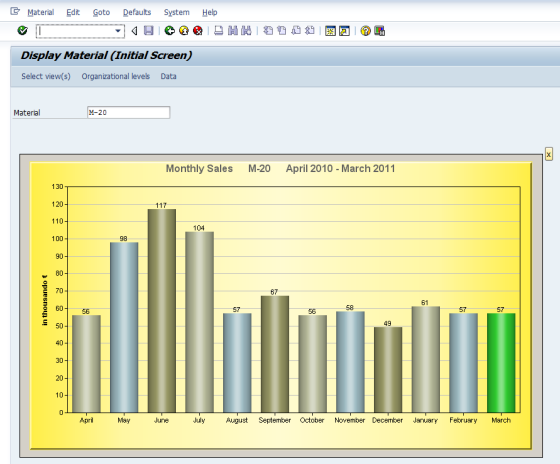
ユーザーがボタンをクリックすると、過去12か月間の商品の月間売上高を示す棒グラフを表示します(このグラフは現在のSAPデータから生成されます)。
これを実装するには、以下の手順で行います。
(1) SAPからデータを読み込む
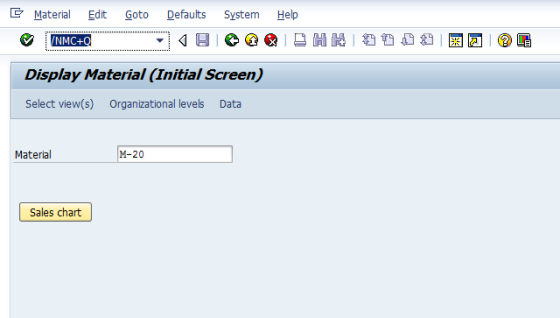
これは、BAPIコール、データベースへの直接アクセス、または既存のSAPトランザクションによって実現します。今回の例では、売上高をABAPリストとして表示する標準のトランザクションである”MC+Q”を使用します。
(2) チャートを生成する外部のツールにデータを渡す
今回の例では、”Advanced Software Engineering Limited”(http://www.advsofteng.com)の”ChartDirector”を使用します。ここでは、VBScriptを用いてGuiXTからグラフィックコンポーネントにデータを渡します。
(3) SAP GUIウィンドウにチャートを表示する
ここでは、Windows標準のフォーム画像コントロールである”Forms.Image.1″を使用します。
MM03用のGuiXTスクリプト
// saplmgmm.e0060
if V[MM03_display_sales_chart=X]
Control (4,1) (26,120) name=“MM03_sales_chart”progid=“Forms.Image.1” initflag=“chartinit”
if V[chartinit=X]
CallVbs generate_chart “&V[MM03_sales_chart]”
endif
Pushbutton (4,121) “x”process=“mm03_display_sales_chart_reset.txt”
else
Pushbutton (4,1) “Sales chart”process=“mm03_display_sales_chart.txt”
endif
InputScriptの”mm03_display_sales_chart.txt”は、トランザクションMC+Qを用いて売上高の表示を呼び出し、必要なデータをABAPリストから抽出します。InputScriptによってバックグラウンドで処理されるInputScriptと画面を以下に示します。
// save material number
Set V[MM03_matnr] “&F[Material]”
// transaction MC+Q
Enter “/NMC+Q
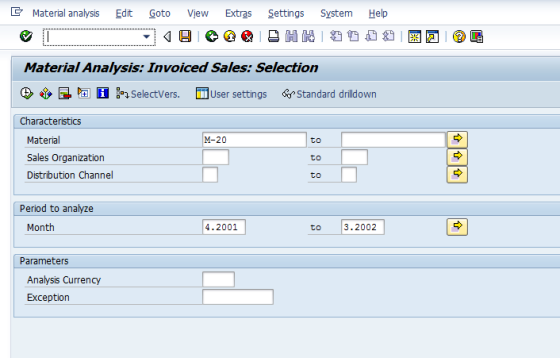
// Material Analysis: Invoiced Sales: Selection
Screen RMCV0200.1000
// Month selection, e.g. 07.2010 – 06.2011
Set V[y2] “&V[today_y]”
Set V[m2] “&V[today_m]” + 0 // e.g.: 01 -> 1
if V[m2=12]
Set V[y1] “&V[y2]”
Set V[m1] “1”
else
Set V[y1] &V[y2] – 1
Set V[m1] &V[m2] + 1
endif
Set F[Material] “&V[MM03_matnr]”
Set F[Sales Organization] “”
Set F[Distribution Channel] ” ”
Set F[Month] “&V[m1].&V[y1]”
Set F[Month to] “&V[m2].&V[y2]”
Enter “/8” // Execute
// Information screen may occur, e.g. “no data available”
Screen SAPMSDYP.0010
Enter
// back to selection screen? then no data found for this selection
Screen RMCV0200.1000
Message “E: No sales data found for product number &V[MM03_matnr]” -statusline
Enter “/NMM03”
Leave
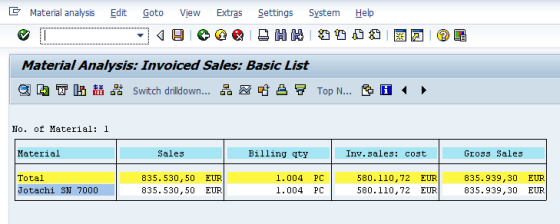
// Material Analysis: Invoiced Sales: Basic List
Screen RMCV0200.0120
Enter “/7” // Switch drilldown…
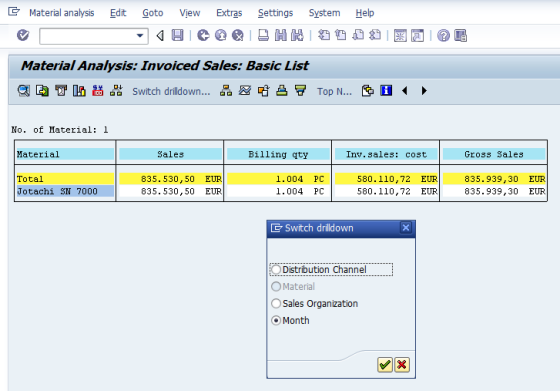
// Switch drilldown
Screen SAPLMCS2.0201
Set R[Month] “X”
Enter
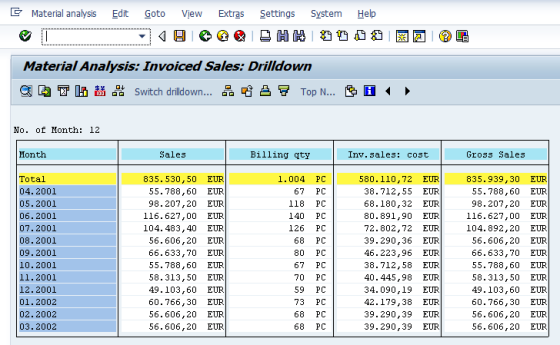
Screen RMCV0200.0120
// Month names
Set V[monthname.1] “January”
Set V[monthname.2] “February”
Set V[monthname.3] “March”
Set V[monthname.4] “April”
Set V[monthname.5] “May”
Set V[monthname.6] “June”
Set V[monthname.7] “July”
Set V[monthname.8] “August”
Set V[monthname.9] “September”
Set V[monthname.10] “October”
Set V[monthname.11] “November”
Set V[monthname.12] “December”
// Set chart title
Set V[chart.title] “Monthly Sales &V[MM03_matnr]&V[monthname.&V[m1]] &V[y1] – &V[monthname.&V[m2]]&V[y2]”
// Set labels
Set V[k] 1
Set V[month] “&V[m1]”
label next_month_label
// set label
Set V[chart.label.&V[k]] “&V[monthname.&V[month]]”
// reset month values
Set V[chart.amount.&V[k]] “0”
// reverse month index
// necessary since the SAP list does not always contain each month
Set V[reverse_month.&V[month]] “&V[k]”
if V[k<12]
Set V[k] &V[k] + 1
if V[month=12]
Set V[month] “1”
else
Set V[month] &V[month] + 1
endif
goto next_month_label
endif
// xtract sales figures from ABAP list
Set V[k] 6
label next_month_in_list
Set V[dot] “&V[_listline(&V[k])](4-4)”
if not V[dot=.]
goto end_month_in_list
endif
// month, year and sales amount from list display
Set V[month] “&V[_listline(&V[k])](2-3)” + 0 // 01 -> 1 etc.
Set V[amount] “&V[_listline(&V[k])](21-34)” / 1000decimals=0 decimalseparator=UserDefault
Set V[chart.amount.&V[reverse_month.&V[month]]]“&V[amount]”
// next month
Set V[k] &V[k] + 1
goto next_month_in_list
label end_month_in_list
Set V[MM03_display_sales_chart] “X”
Enter “/NMM03”
InputScriptの”mm03_display_sales_chart_reset.txt”は非常にシンプルです。
Set V[MM03_sales_chart] “”
Set V[MM03_display_sales_chart] “”
Return
今回のVBScript関数”generate_chart”は、”ChartDirector”コンポーネントを使用してチャートを生成し、それを画像コントロールに渡します。これは、ChartDirectorヘルプファイルに含まれる各種サンプルのひとつをベースにしています。
‘ The example uses ChartDirector from Advanced Software Engineering Limited
‘ http://www.advsofteng.com/
Function generate_chart(img)
Dim cd
Set cd = guixt.CreateObject(“ChartDirector.API”)
‘ Set license code
cd.setLicenseCode(“xxxx-xxxx-xxxx-xxxx-xxxx-xxxx”)
‘ The data for the bar chart
Dim data(11)
Dim labels(11)
For k = 1 To 12
data(k-1) = CInt(guixt.Get(“chart.amount.” & k))
labels(k-1) = guixt.Get(“chart.label.” & k)
Next
‘ The colors for the bar chart
Dim colors
colors = Array(&Hb8bc9c, &Ha0bdc4, &H999966, &Hb8bc9c, &Ha0bdc4, &H999966,&Hb8bc9c, &Ha0bdc4, &H999966,&Hb8bc9c, &Ha0bdc4, &H30cc30)
‘ Create an XYChart object of size 800 x 460 pixels, golden background
Dim c
Set c = cd.XYChart(800, 460, cd.goldColor(), -1, 2)
‘ Add a title box using 12 point Arial Bold font.
Call c.addTitle(guixt.Get(“chart.title”), ”arialbd.ttf”, 12, &H606060)
‘ Set the plotarea at (60, 40) and of size 720 x 360 pixels
Call c.setPlotArea(60, 40, 720, 360)
‘ Add a multi-color bar chart layer using the given data and colors
Dim layer
Set layer = c.addBarLayer3(data, colors)
‘ Use a 1 pixel 3D border for the bars.
Call layer.setBorderColor(-1, 1)
‘ Set bar shape to circular (cylinder)
Call layer.setBarShape(cd.CircleShape)
‘ Enable bar label for the whole bar
Call layer.setAggregateLabelStyle()
‘ Set the labels on the x axis.
Call c.xAxis().setLabels(labels)
’ Add a title to the y axis
Call c.yAxis().setTitle(“in thousands €”)
‘ Output the chart
Set img.Picture = c.makePicture()
End Function