ダイアグラムとチャートを作成する
チャートやダイアグラムを作成する場合、.NETのSystem.Windows.Forms.DataVisualization.Chartクラスを使用することができます。
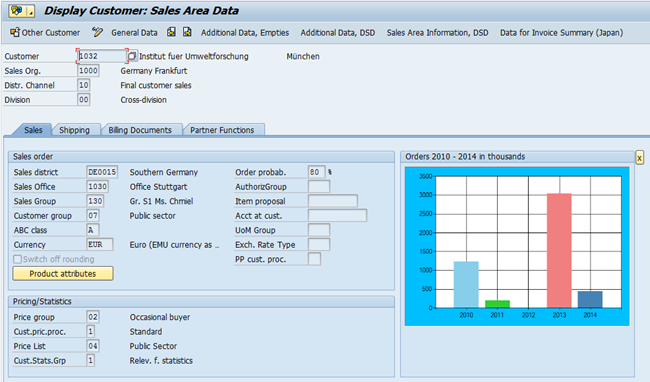
今回は、このクラスを使用して、ダイアグラム”orders”(発注金額)をトランザクションVD03(顧客の表示)の販売エリアデータに組み込みます。
この実装は以下の手順で行います。
- ダイアグラムを表示するためのプッシュボタンを挿入し、画像ファイルを表示します。
- 発注データを読み込みます。
- ダイアグラムを画像ファイルとして作成します。
最初の部分は数行のコードで十分です。
// Reset variables if new transaction or new customer
if not V[VD03_transactionid=&V[_transactionid]]
or not V[VD03_kunnr=&F[RF02D-KUNNR]]
Set V[VD03_*] “”
Set V[VD03_transactionid] “&V[_transactionid]”
Set V[VD03_kunnr] “&F[RF02D-KUNNR]”
endif
if Q[transaction=VD03] and Q[Page=Verkauf] Set V[chartfilename] “&%[TEMP]\saleschart.&V[VD03_kunnr].png”
// display chart?
if V[VD03_display_chart=X]
Box (7,86) (22,135) “Orders &V[year4] – &V[year0] in thousands”
Pushbutton (7,137) “x” size=(1,1) process=“chart_close.txt”
Image (8,87) “&V[chartfilename]” -nobuffer
else
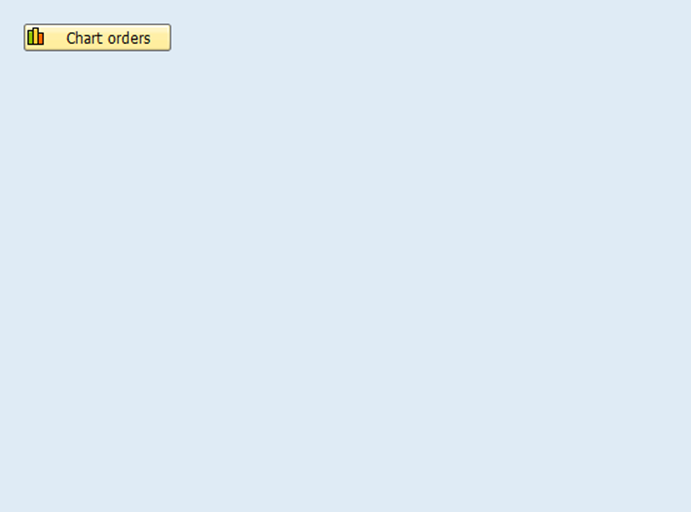
Pushbutton (7,86) “@NF\QDisplay chart@Chart orders”process=“chart_open.txt”
endif
endif
InputScript “chart_open.txt”:
// Generate chart
…
// Display chart
Set V[VD03_display_chart] “X”
Return
InputScript “chart_close.txt”:
// Close chart
Set V[VD03_display_chart] “”
Return
ユーザーは、ボタンを押してダイアグラムを呼び出せます。また、後でダイアグラムをクローズできます。
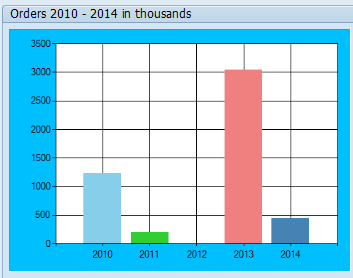
ダイアグラムのデータを読み込むため、関数モジュール/guixt/selectを使用します。ここでは、販売情報システム(VIS)の統計テーブルのひとつを読み込みます。SAPの標準テーブルであるS001か、パフォーマンス上の問題がある場合はS001のコピー(品目コードのキーを取り除いたもの)を読み込みます。そして、VB.NET関数を呼び出してダイアグラムを作成します。
// Determine years
Set V[year0] &V[today_y]
Set V[year1] &V[year0] – 1
Set V[year2] &V[year0] – 2
Set V[year3] &V[year0] – 3
Set V[year4] &V[year0] – 4
// ialize sales figues
Set V[sales0] 0
Set V[sales1] 0
Set V[sales2] 0
Set V[sales3] 0
Set V[sales4] 0
// key values
Set V[kunnr] “&F[RF02D-KUNNR]”
Set V[vkorg] “&F[RF02D-VKORG]”
Set V[vtweg] “&F[RF02D-VTWEG]”
Set V[spart] “&F[RF02D-SPART]”
// leading zeros
Set V[kunnr](1-10) “0000000000&V[kunnr]” -alignright
// search condition
Set V[condition] “KUNNR = ‘&V[kunnr]’ and VKORG = ‘&V[vkorg]’ and VTWEG = ‘&V[vtweg]’ and SPART = ‘&V[spart]’ and SPMON GE ‘&V[year4]01′”
// read VIS statistics table S001
Call /guixt/select in.Table=“S951”in.Condition=“&V[condition]” in.Fields=“SPMON,AENETWR”table.V1table=“r1” table.V2table=“r2”
// Build sales figures
Set V[i] 1
label next
CopyText fromText=“r1” toString=“spmon” line=“&V[i]”
if Q[ok]
CopyText fromText=“r2” toString=“aenetwr” line=“&V[i]”
Set V[i] &V[i] + 1
Set V[year] &V[spmon](1-4)
// year0
if V[year=&V[year0]]
Set V[sales0] &V[sales0] + &V[aenetwr]
goto next
endif
// year1
if V[year=&V[year1]]
Set V[sales1] &V[sales1] + &V[aenetwr]
goto next
endif
// year2
if V[year=&V[year2]]
Set V[sales2] &V[sales2] + &V[aenetwr]
goto next
endif
// year3
if V[year=&V[year3]]
Set V[sales3] &V[sales3] + &V[aenetwr]
goto next
endif
// year4
if V[year=&V[year4]]
Set V[sales4] &V[sales4] + &V[aenetwr]
goto next
endif
goto next
endif
// in thousands
Set V[sales0] &V[sales0] / 1000 decimals=0
Set V[sales1] &V[sales1] / 1000 decimals=0
Set V[sales2] &V[sales2] / 1000 decimals=0
Set V[sales3] &V[sales3] / 1000 decimals=0
Set V[sales4] &V[sales4] / 1000 decimals=0
// generate chart
CallVB Chart01.Customer.SalesChart &quo”&V[chartfilename]”
VB.NET関数で作成する画像ファイルの名前を渡します。
ダイアグラムで必要なデータ(発注金額と発注年)は、GuiXT変数から直接取り出せます。
| 1 | Imports System.Windows.Forms |
| 2 | Imports System.Data |
| 3 | Imports System.Drawing |
| 4 | Imports System.Windows.Forms.DataVisualization.Charting |
| 5 | |
| 6 | |
| 7 | Public Class customer |
| 8 | |
| 9 | Private guixt As New guinet.guixt |
| 10 | |
| 14 | Public Sub SalesChart(ByVal imgfilename As String) |
| 15 | |
| 16 | ‘ create chart |
| 17 | Dim Chart1 As New Chart() |
| 18 | |
| 19 | Chart1.Size = New System.Drawing.Size(480, 340) |
| 20 | Chart1.BackColor = Color.DeepSkyBlue |
| 21 | |
| 22 | Dim ChartArea1 As New ChartArea |
| 23 | |
| 24 | ChartArea1.Name = “ChartArea1” |
| 25 | Chart1.ChartAreas.Add(ChartArea1) |
| 26 | |
| 27 | Dim Series1 As New Series |
| 28 | Series1.ChartArea = “ChartArea1” |
| 29 | Series1.Palette = ChartColorPalette.Pastel |
| 30 | Series1.XValueMember = “Year” |
| 31 | Series1.YValueMembers = “Sales” |
| 32 | Chart1.Series.Add(Series1) |
| 33 | |
| 34 | Dim table As New DataTable |
| 35 | |
| 36 | ‘ Create columns in the DataTable |
| 37 | table.Columns.Add(“Year”, GetType(String)) |
| 38 | table.Columns.Add(“Sales”, GetType(Integer)) |
| 39 | |
| 40 | ‘ Add sales figures for 5 years, using GuiXT variables |
| 41 | table.Rows.Add(guixt.GetVariable(“year4”), _ |
| 42 | CInt(guixt.GetVariable(“sales4”))) |
| 43 | |
| 44 | table.Rows.Add(guixt.GetVariable(“year3”), _ |
| 45 | CInt(guixt.GetVariable(“sales3”))) |
| 46 | |
| 47 | table.Rows.Add(guixt.GetVariable(“year2”), _ |
| 48 | CInt(guixt.GetVariable(“sales2”))) |
| 49 | |
| 50 | table.Rows.Add(guixt.GetVariable(“year1”), _ |
| 51 | CInt(guixt.GetVariable(“sales1”))) |
| 52 | |
| 53 | table.Rows.Add(guixt.GetVariable(“year0”), _ |
| 54 | CInt(guixt.GetVariable(“sales0”))) |
| 55 | |
| 56 | ‘ Chart data |
| 57 | Chart1.DataSource = table |
| 58 | |
| 59 | ‘ save chart as .png file |
| 60 | Chart1.SaveImage(imgfilename, ChartImageFormat.Png) |
| 61 | |
| 62 | End Sub |
| 63 | End Class |